Rebranding Splunk Through Systematic Design Solutions

  • My Role: Senior User Interface (UI) Designer

  • Organization Splunk

Impact at a Glance

  • $680M ARR Growth from $1.68B to $2.36B (41% year-over-year growth, 2020-2021)
  • Design system architect enabling brand consistency across 200+ pages
  • 44% growth in enterprise customers with 510 customers at $1M+ ARR (up from 355)
  • 2x user conversion rate on community platform redesign achieving 2M+ page views in the first month
  • “Best New Enterprise Software Marketing of the Year” –  Constellation Media Award

Splunk needed to translate their bold new brand identity into their complex marketing interfaces. We needed to communicate the advantages of using Splunk and create scalable design systems that could evolve with the brand.

Understanding the competitive landscape where, as Splunk’s CMO noted, “7 out of 10 tech brands are blue, or green, or green and blue,” the challenge was making Splunk’s new pink and orange brand colors work effectively in digital environments while maintaining accessibility and usability standards.

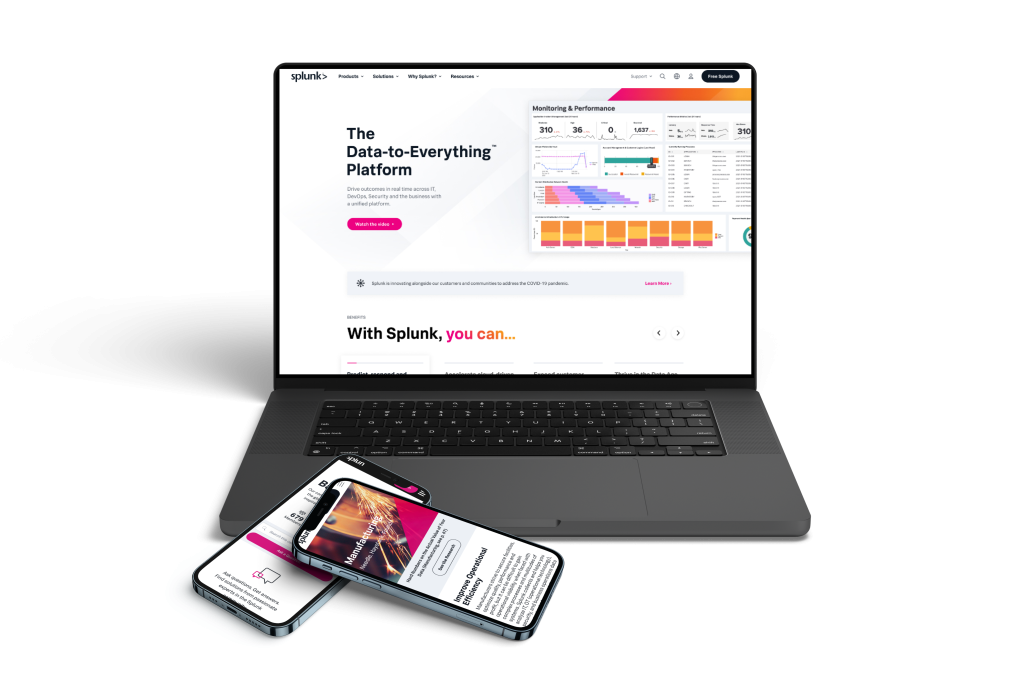
As a senior user interface designer on Splunk’s major brand refresh, I contributed to translating their new “Data to Everything” brand identity into cohesive digital experiences across their product ecosystem. My work encompassed contributing to the inception and development of a comprehensive design system, redesigning marketing touchpoints, and creating visually engaging and intuitive user interfaces during Splunk’s complete brand overhaul.
Objectives

  • Design and develop a scalable design system in the new brand to establish a single source of truth for consistent visual language and operational efficiency
  • Redesign and optimize all marketing screens, auditing and iterating on existing UI and standardizing interaction patterns to improve user experience and engagement
  • Expand digital content with new strategic pages, including compelling case studies and SEO-optimized content
Design System Development

I collaborated with the design team to develop a comprehensive design system that served as the foundation for all digital experiences, ensuring brand consistency and operational efficiency across Splunk’s complex product ecosystem.

Platform & Process Strategy

I advocated for migrating from Sketch to Figma to enable real-time collaboration essential for our team’s work on the design system. This enabled automatic propagation of design updates across all product files, ensuring brand consistency at scale.

User Research & Analytics

During initial development, I reviewed user testing videos and analyzed user analytics including heat maps to understand patterns involving page scroll depth and user interest as we defined core interactive components like buttons and forms. This early validation ensured our new branded elements would perform effectively before building out the complete system.

Testing insights and analytics data directly informed button hierarchy, form design patterns, interactive states, and baseline component behaviors that would scale across the entire system, ensuring brand expression never compromised core interaction patterns.

Icon System Optimization

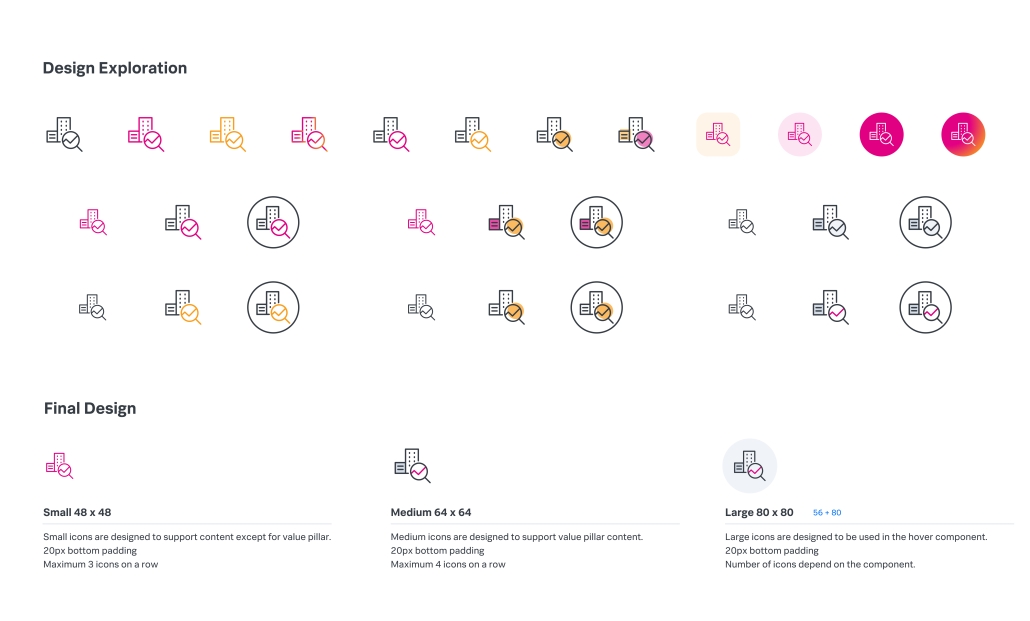
I extended the icon library by illustrating new icons while comprehensively enhancing the entire system:

  • Standardized three icon sizes for consistent visual hierarchy
  • Eliminated redundant icons and redesigned outliers that didn’t align with the system
  • Standardized line weights for visual cohesion
  • Focused on balance and weight to ensure icons work well in proximity

This transformed inconsistent icons into cohesive visual language. I also designed “iconistrations,” systematic illustrations constructed from the icon library that provide scalable visual storytelling while maintaining brand consistency.

Splunk Color Palette

Color System Solutions

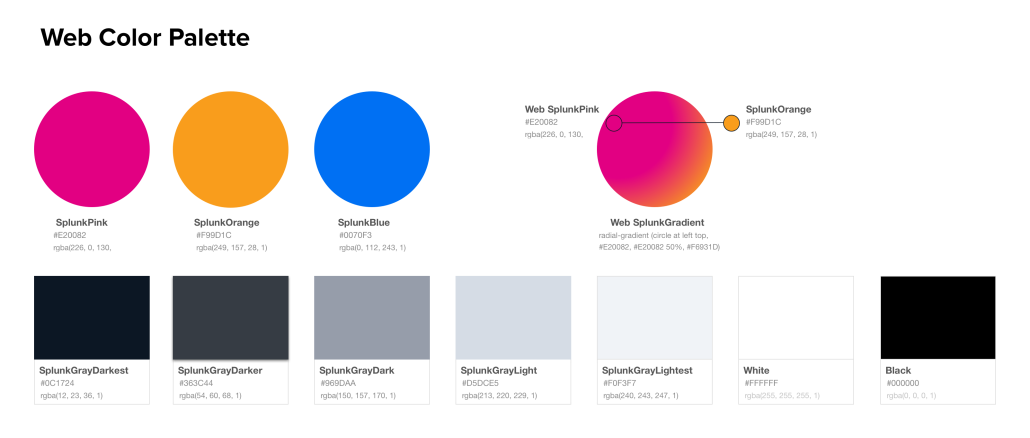
Understanding the competitive landscape where, as Splunk’s CMO noted, “7 out of 10 tech brands are blue, or green, or green and blue,” I adapted the new brand’s pink and orange colors to optimize them for digital use while addressing critical usability issues.

Grayscale Redesign: The existing gray palette had values too similar to differentiate effectively, with the lightest background color nearly invisible on some screens. I developed a new grayscale system with proper contrast ratios and reliable visibility across devices.

ADA Compliance Solutions: The new brand’s pink and orange colors didn’t meet contrast requirements for text usage. I adapted the pink to a darker tone for button text, established that orange could never be used for text, and developed gradient implementation guidelines for headlines that maintained compliance while preserving the brand’s signature color combination.

I also created usage rules and integrated the established product blue for hypertext links, ensuring brand distinction while maintaining accessibility requirements.

Form System Design

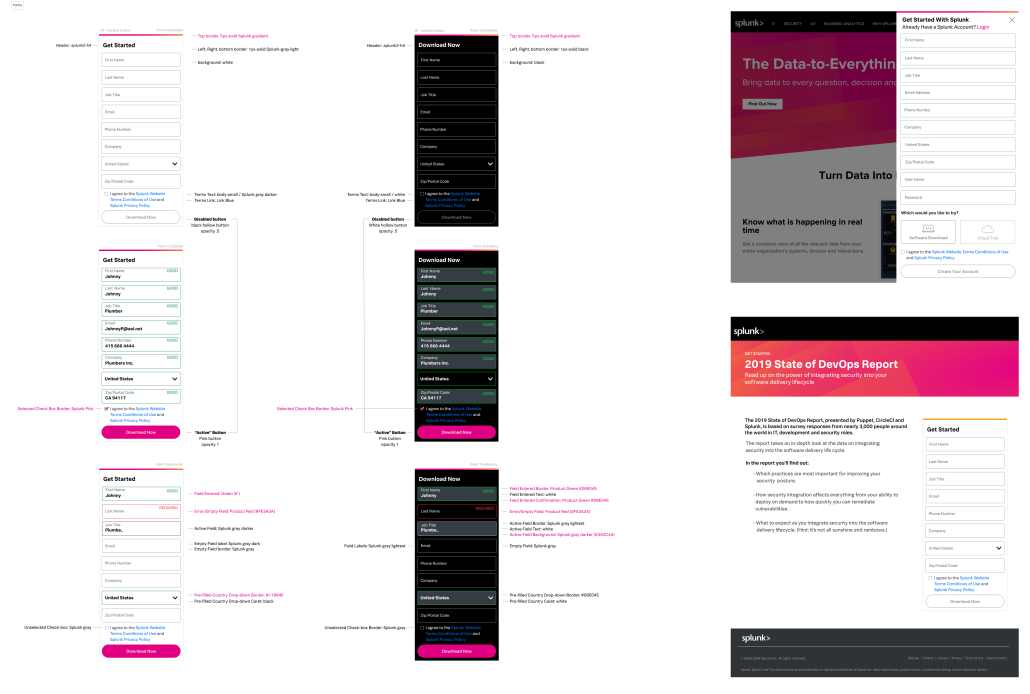
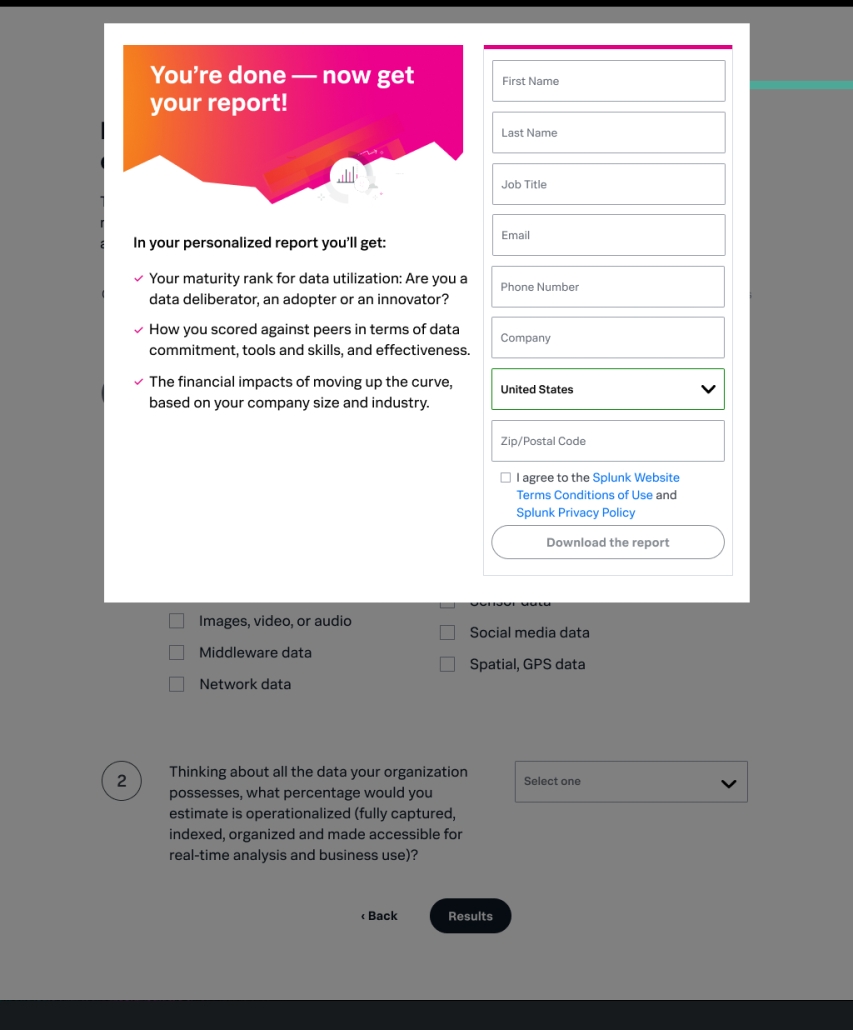
I created a scalable, ADA-compliant form system across Splunk’s marketing touchpoints—from lead generation to community platforms. This included:

  • Defining all interaction states and flexible patterns for diverse use cases
  • Establishing proper accessibility standards and optimized conversion flows
  • Reducing user friction across landing pages, calculators, and registration processes

The system became foundational to lead generation strategy while maintaining brand distinction.

Lead Generation Pages

I designed optimized landing pages and interactive calculators that serve as primary conversion touchpoints, focusing on reducing user friction and strategically guiding prospects through lead capture workflows.

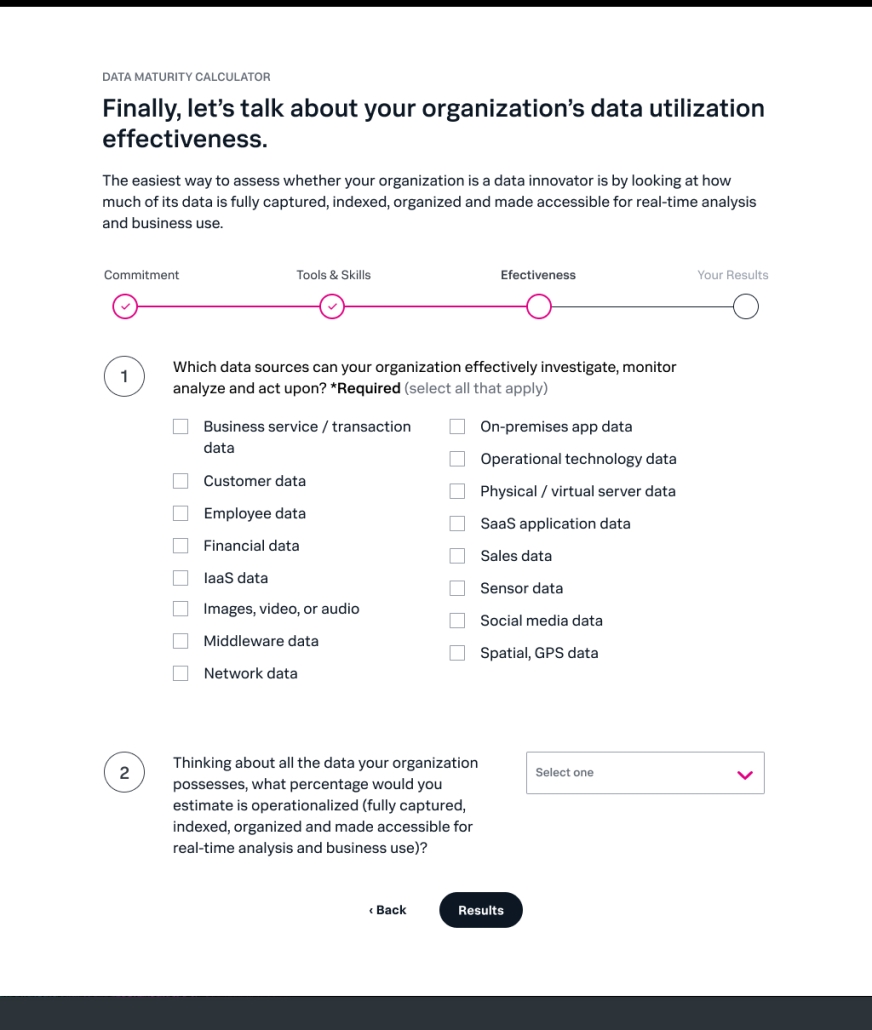
Data Calculators

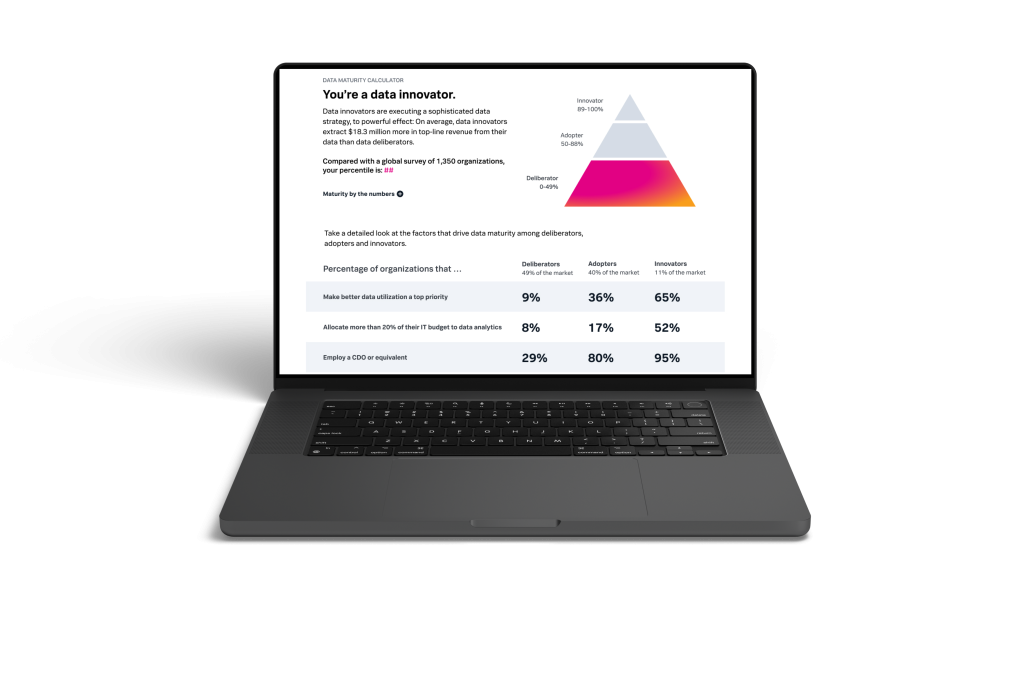
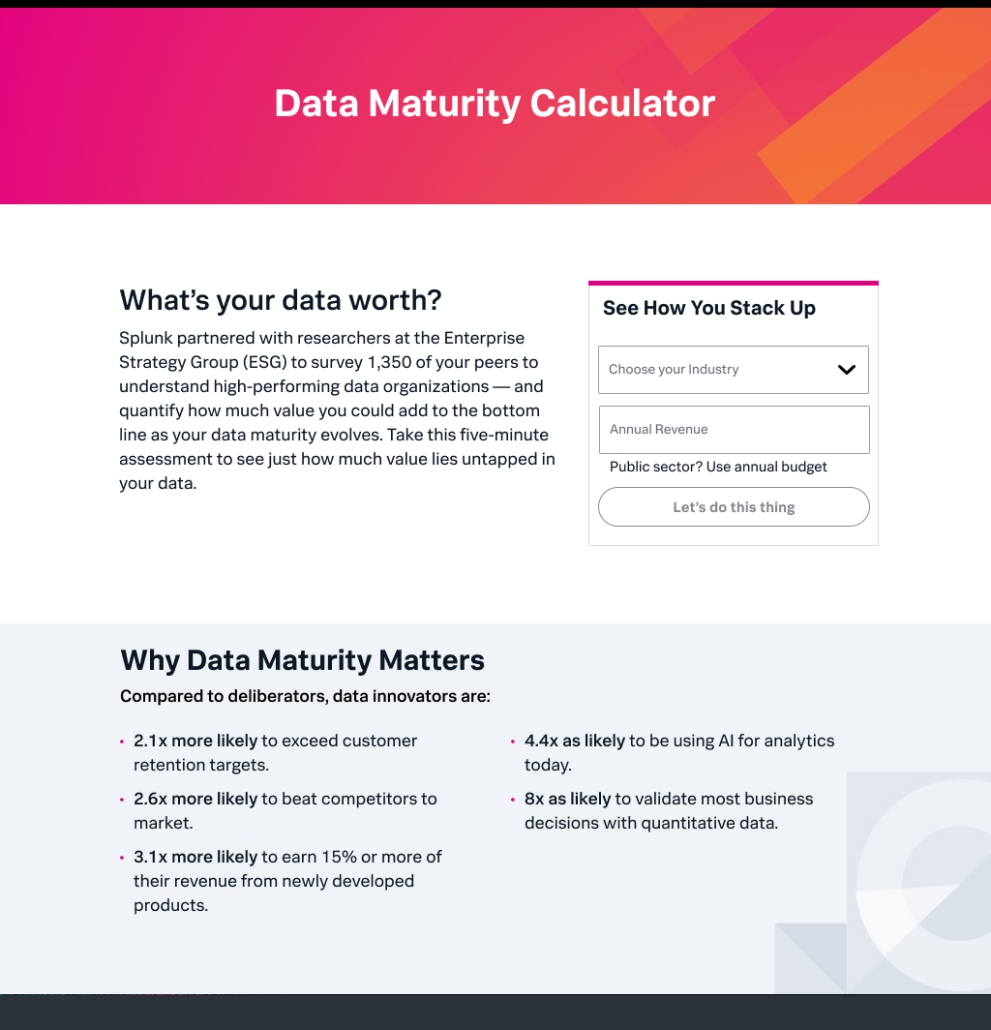
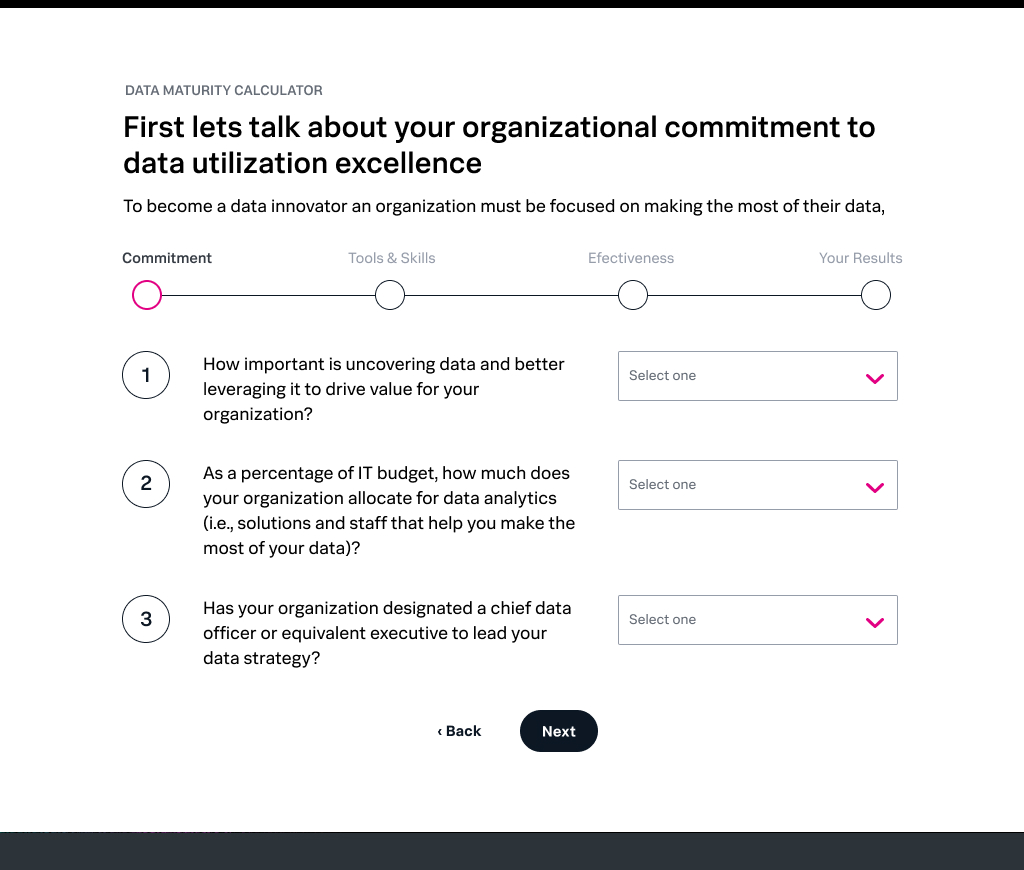
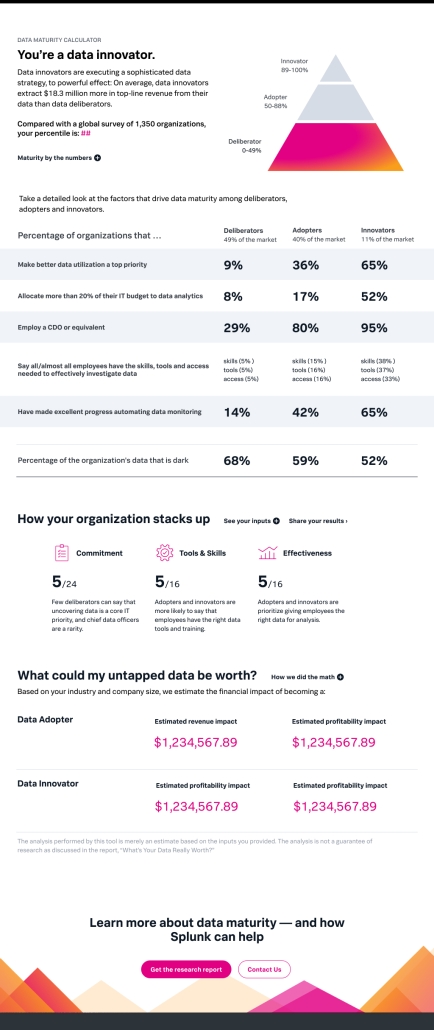
I designed the complete user experience for complex multi-step calculators (Data Maturity, Critical IT Incident, Data Value), including branded landing pages, form interface design, and results screens.

User Experience Focus: The design approach prioritized reducing cognitive load through clear visual hierarchy and intuitive flow patterns. This guided users through complex data inputs while maintaining engagement and leading to actionable insights that demonstrate Splunk’s value proposition.

Landing Pages

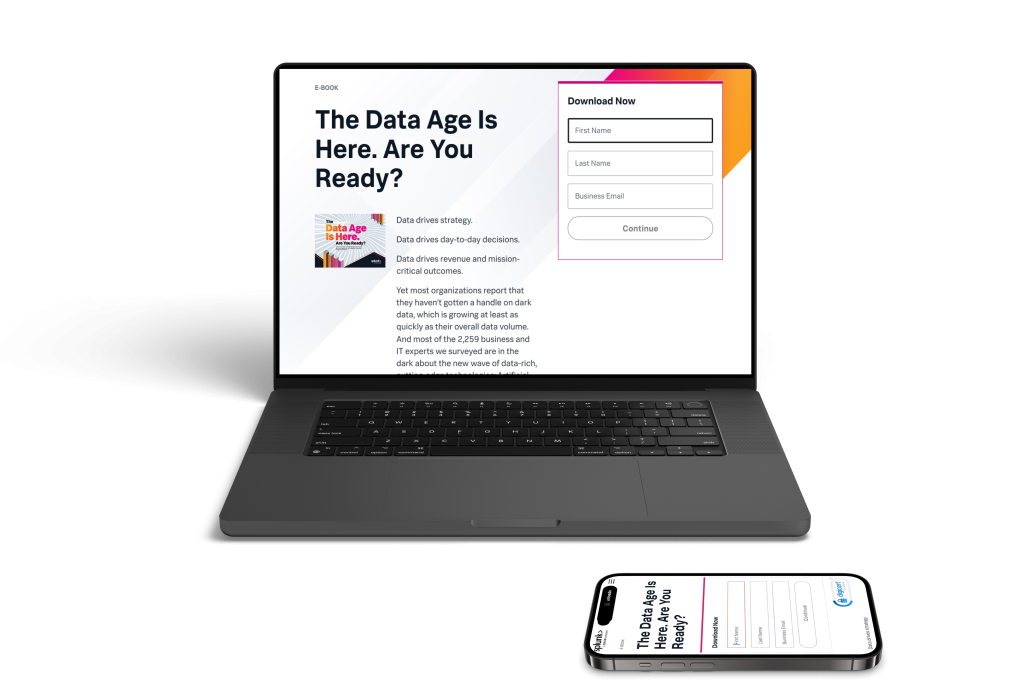
I designed lead generation pages optimized for resource downloads and content engagement. These pages remove friction through:
  • Streamlined layouts that eliminate unnecessary scrolling
  • Strategic form placement that prioritizes conversion paths
  • Trust-building elements that guide users toward conversion actions
  • Clear visual hierarchy that supports the user journey

Platform Design

I designed comprehensive user platforms that facilitate learning, knowledge discovery, and community engagement, creating intuitive experiences for complex user journeys and diverse content types.
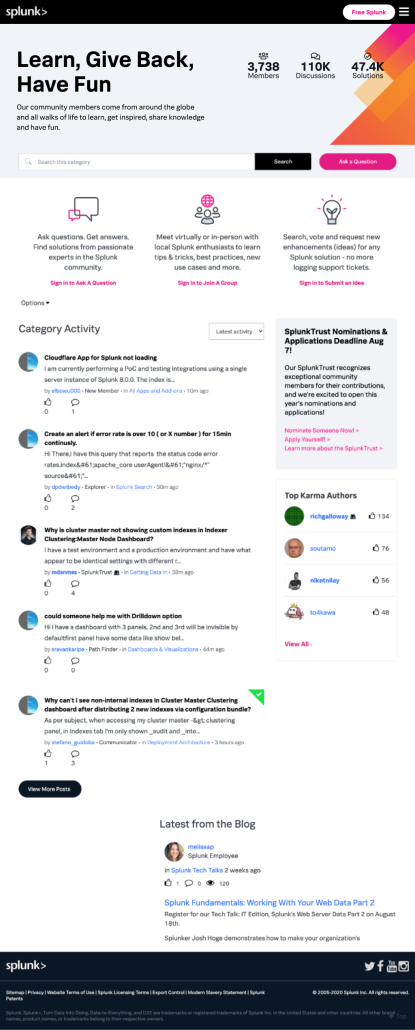
Splunk Lantern

I designed the front page interface for this centralized knowledge hub, creating an intuitive and prioritized entry point for user education and resource discovery. Data dictated prioritization of content and initial options for user journeys.
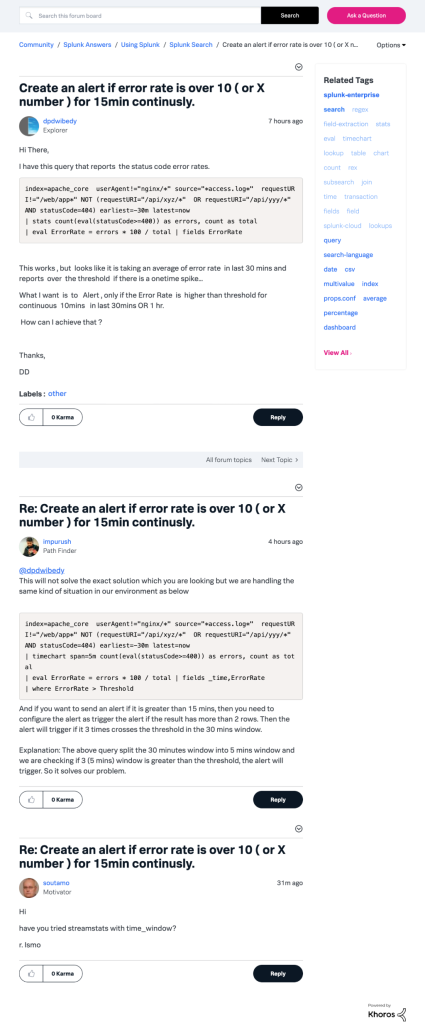
Splunk Community

I partnered with product teams to design the user interface for the community engagement platform built on the Khoros community platform, facilitating peer-to-peer interaction through forums, discussions, and gamification elements.

Key contributions included:

  • Designing intuitive discussion interfaces and user interaction patterns
  • Creating and illustrating achievement badges that users earn when reaching community milestones
  • Establishing visual hierarchy that supports both expert and novice user needs

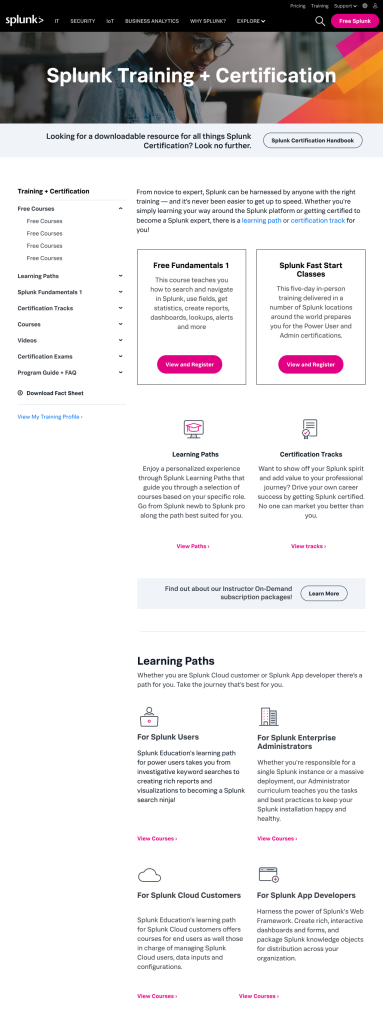
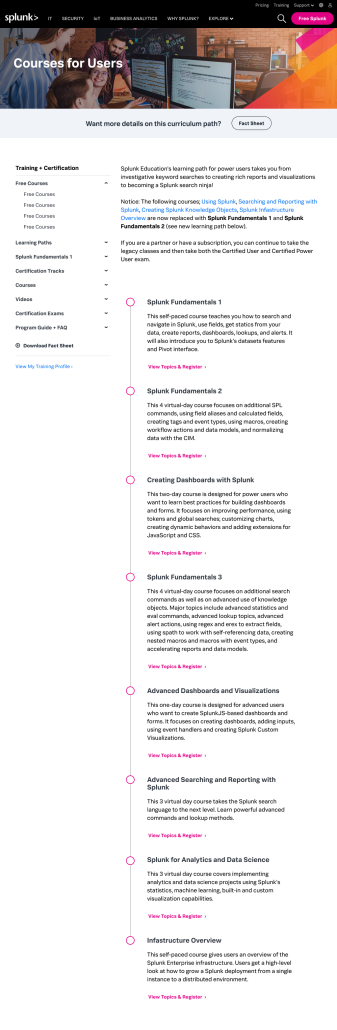
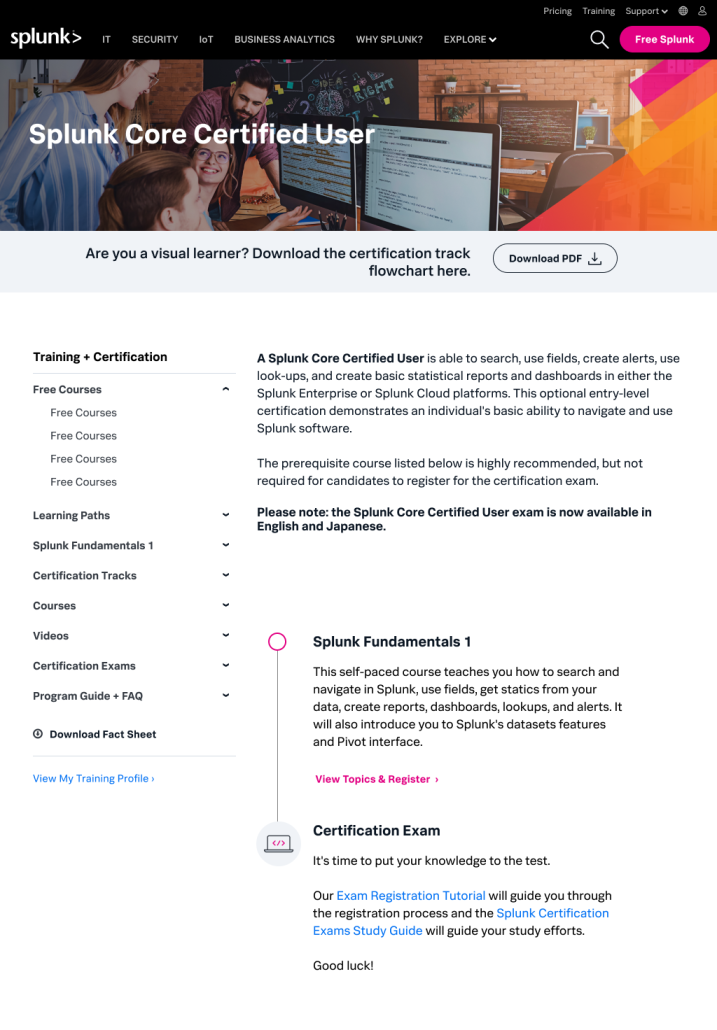
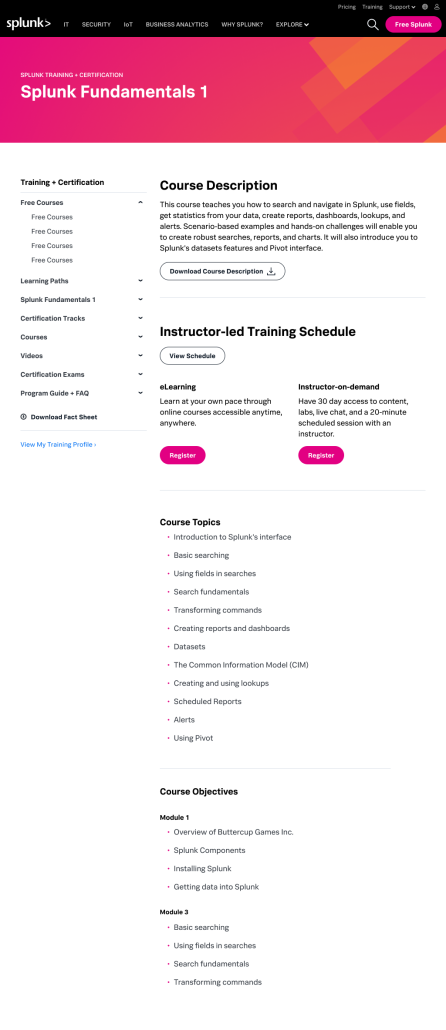
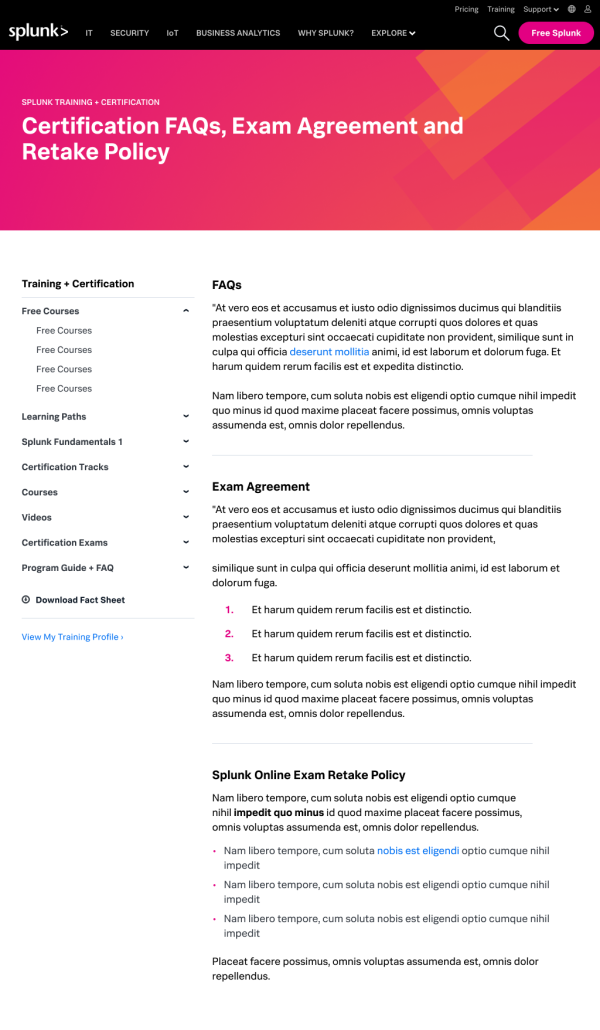
Training & Certification Platform

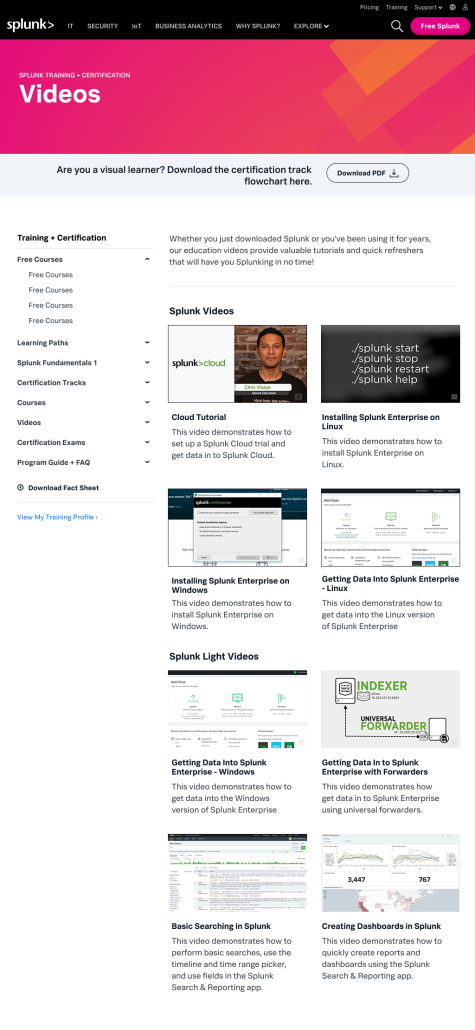
Redesigned the complete learning journey with course overviews, certification paths, and video content integration. The design enhanced user education pathways and improved engagement through clear progression indicators and streamlined navigation.
Product Support

I redesigned critical information touchpoints to ensure users can efficiently access product updates and security communications through clear, scannable interfaces and improved information architecture.

Security Communications

Streamlined critical Security Advisory pages and vulnerability reporting interfaces to ensure clear, accessible information architecture. The design prioritizes critical information hierarchy and supports quick scanning for urgent updates.

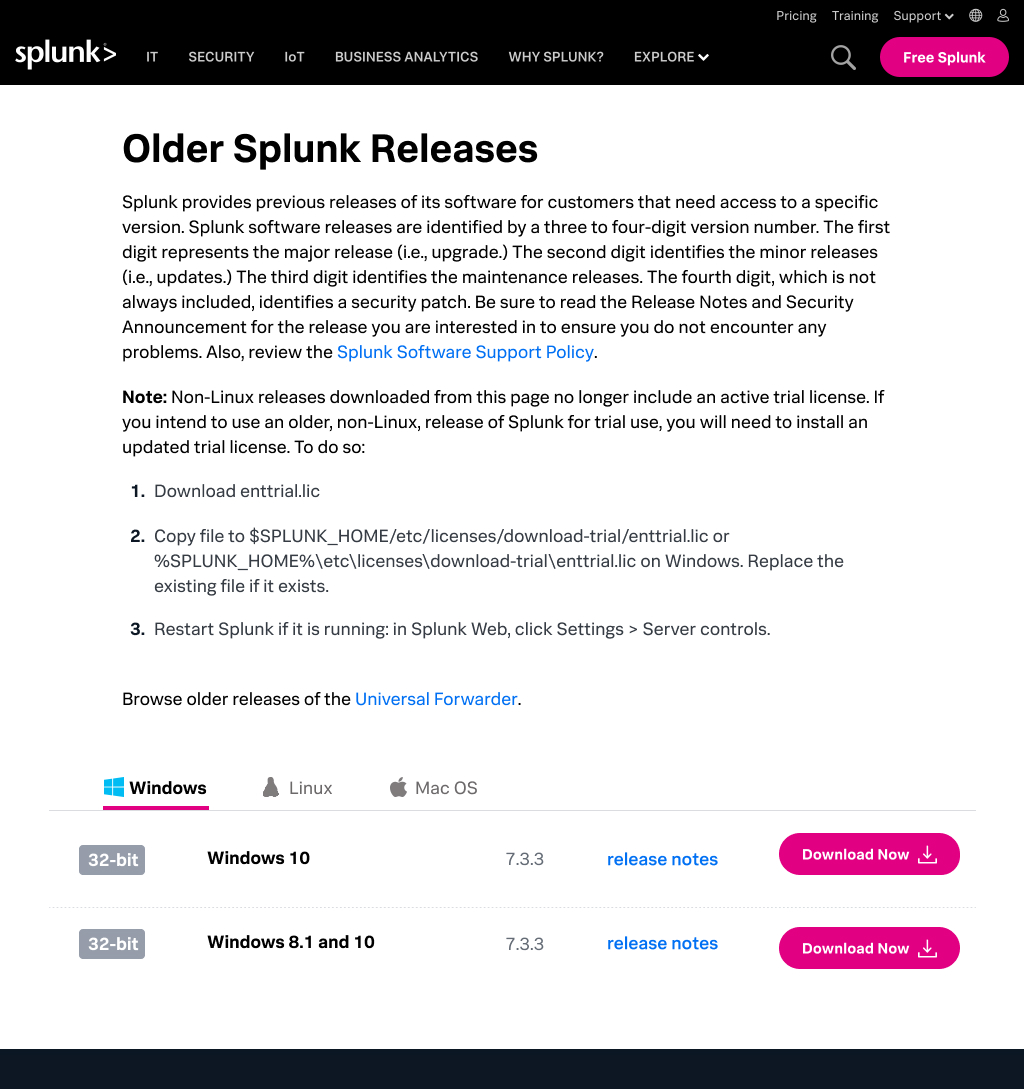
Previous Releases Redesign

Led the complete redesign of Previous Releases pages through wireframing, content organization, and visual design. I strategized for scalability and improved usability for accessing historical product updates, creating consistent patterns that could accommodate future releases.

Visual Storytelling

I developed systematic visual storytelling solutions that transform complex technical concepts into engaging, accessible narratives through both static illustrations and dynamic motion elements.

Motion Design Integration

Incorporated subtle animations and interactive elements throughout the digital experience to enhance engagement and modernize the brand:

  • Parallax scrolling effects that support content hierarchy
  • Short video loops that demonstrate product capabilities
  • Lottie animations for micro-interactions
  • Animated data visualizations that bring complex information to life

These elements enhanced user engagement while maintaining fast load times and accessibility standards.

Technical Documentation

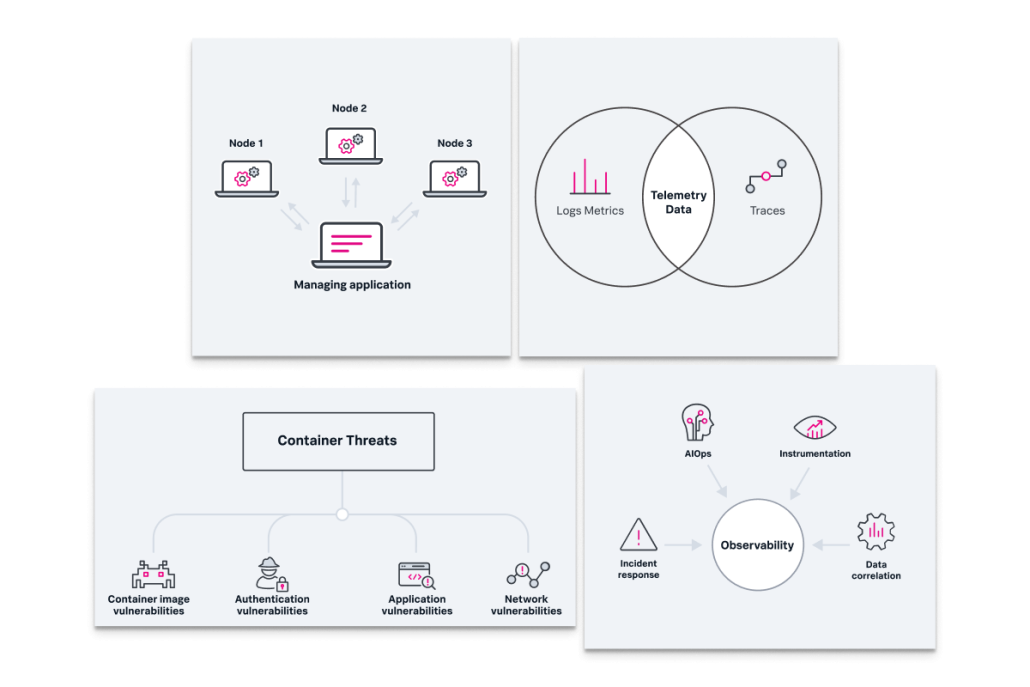
Designed a scalable Diagram Visual Language System for SEO landing pages, transforming complex technical concepts into clear, branded visual explanations. This system leveraged the optimized icon library for consistent brand alignment while communicating intricate systems and solutions effectively.

Campaign Pages

I designed conversion-focused campaign pages for featured documents and resources. These pages capture audience interest through dynamic storytelling, in-page video, and parallax motion effects.

The Data Age Campaign Page

Designed to drive downloads for a critical research report through integrated in-page video and parallax motion effects. The design conveys the power of data, addresses challenges like dark data, and compels users to gain competitive advantage.

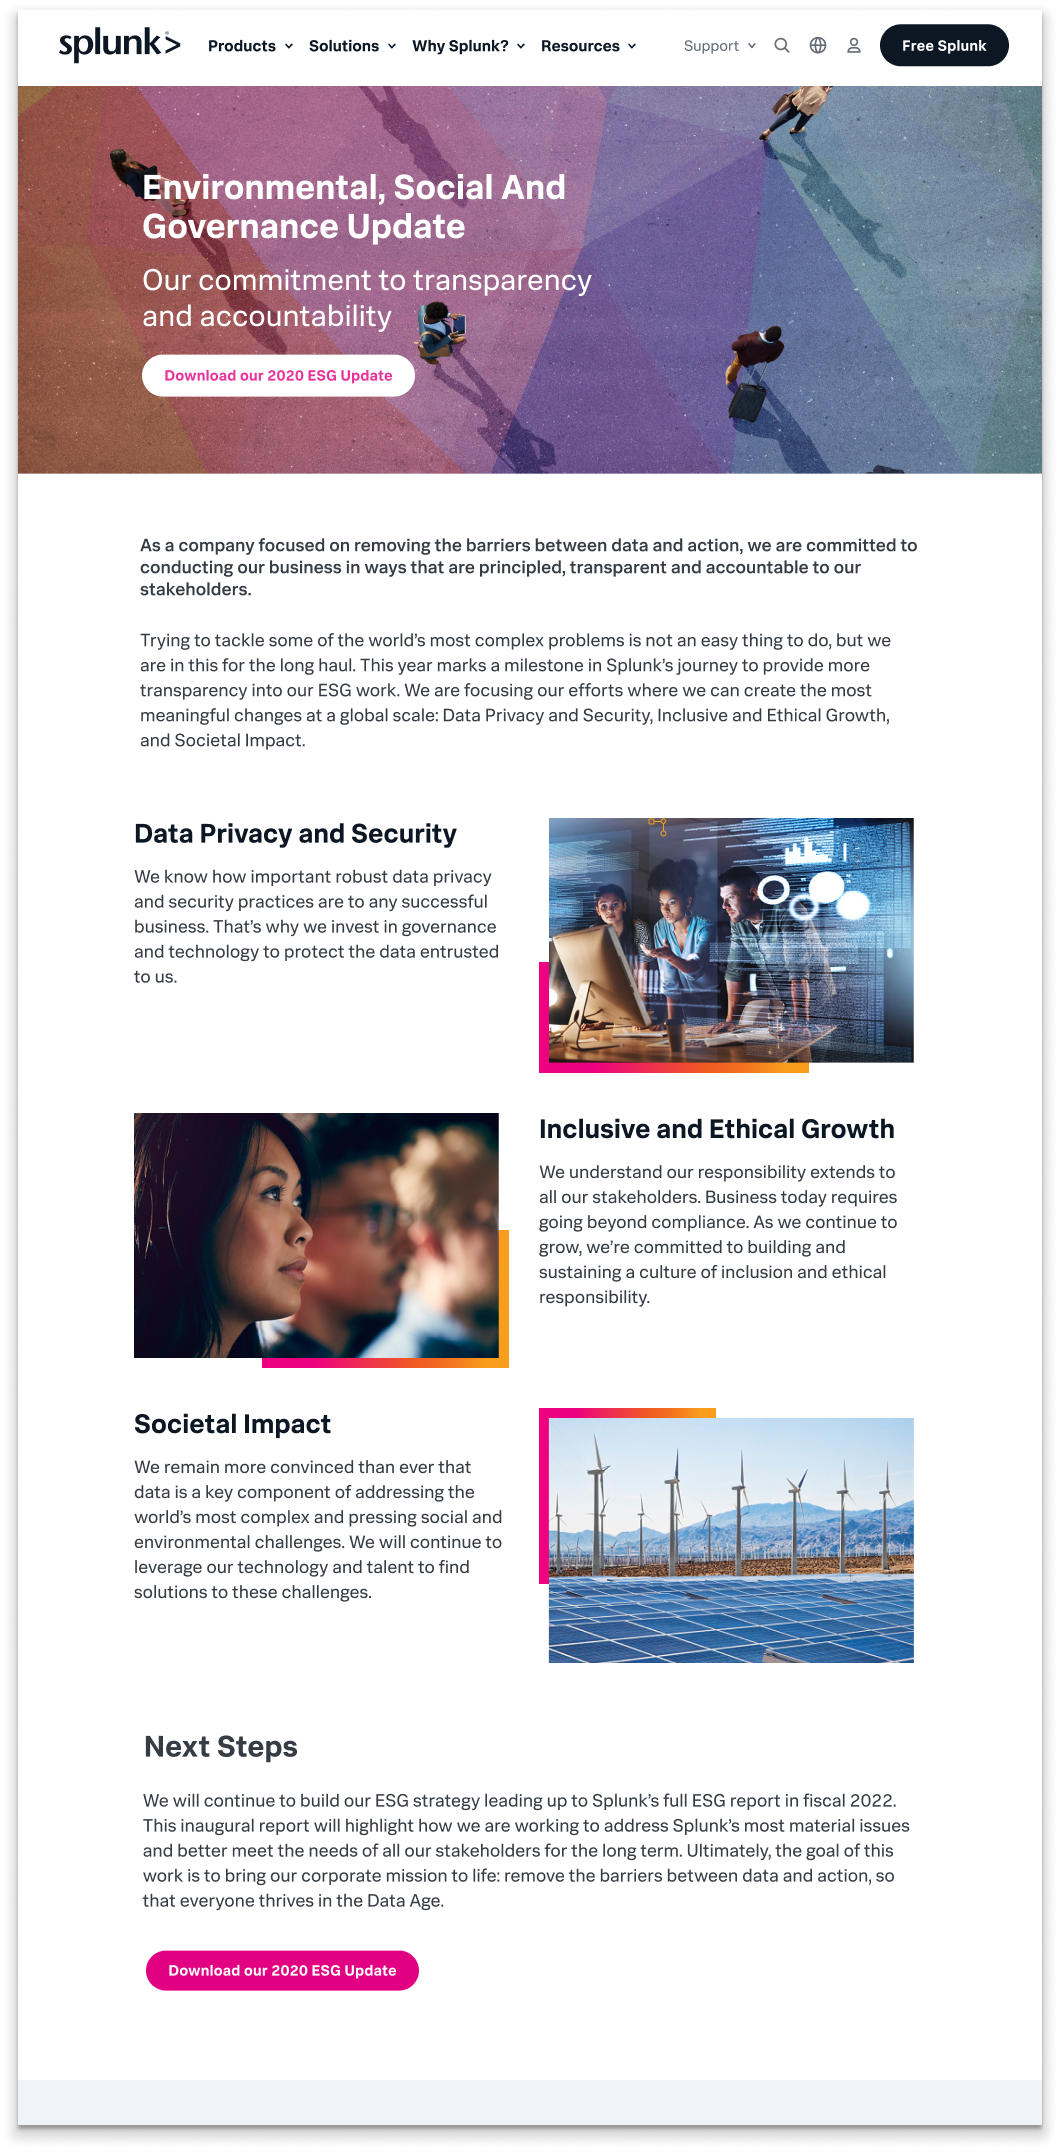
Environmental, Social and Governance (ESG) Campaign Page

Focuses on clearly communicating Splunk’s commitment to sustainability and governance, leveraging visuals and streamlined information architecture to resonate with socially conscious audiences and drive engagement with the detailed report.

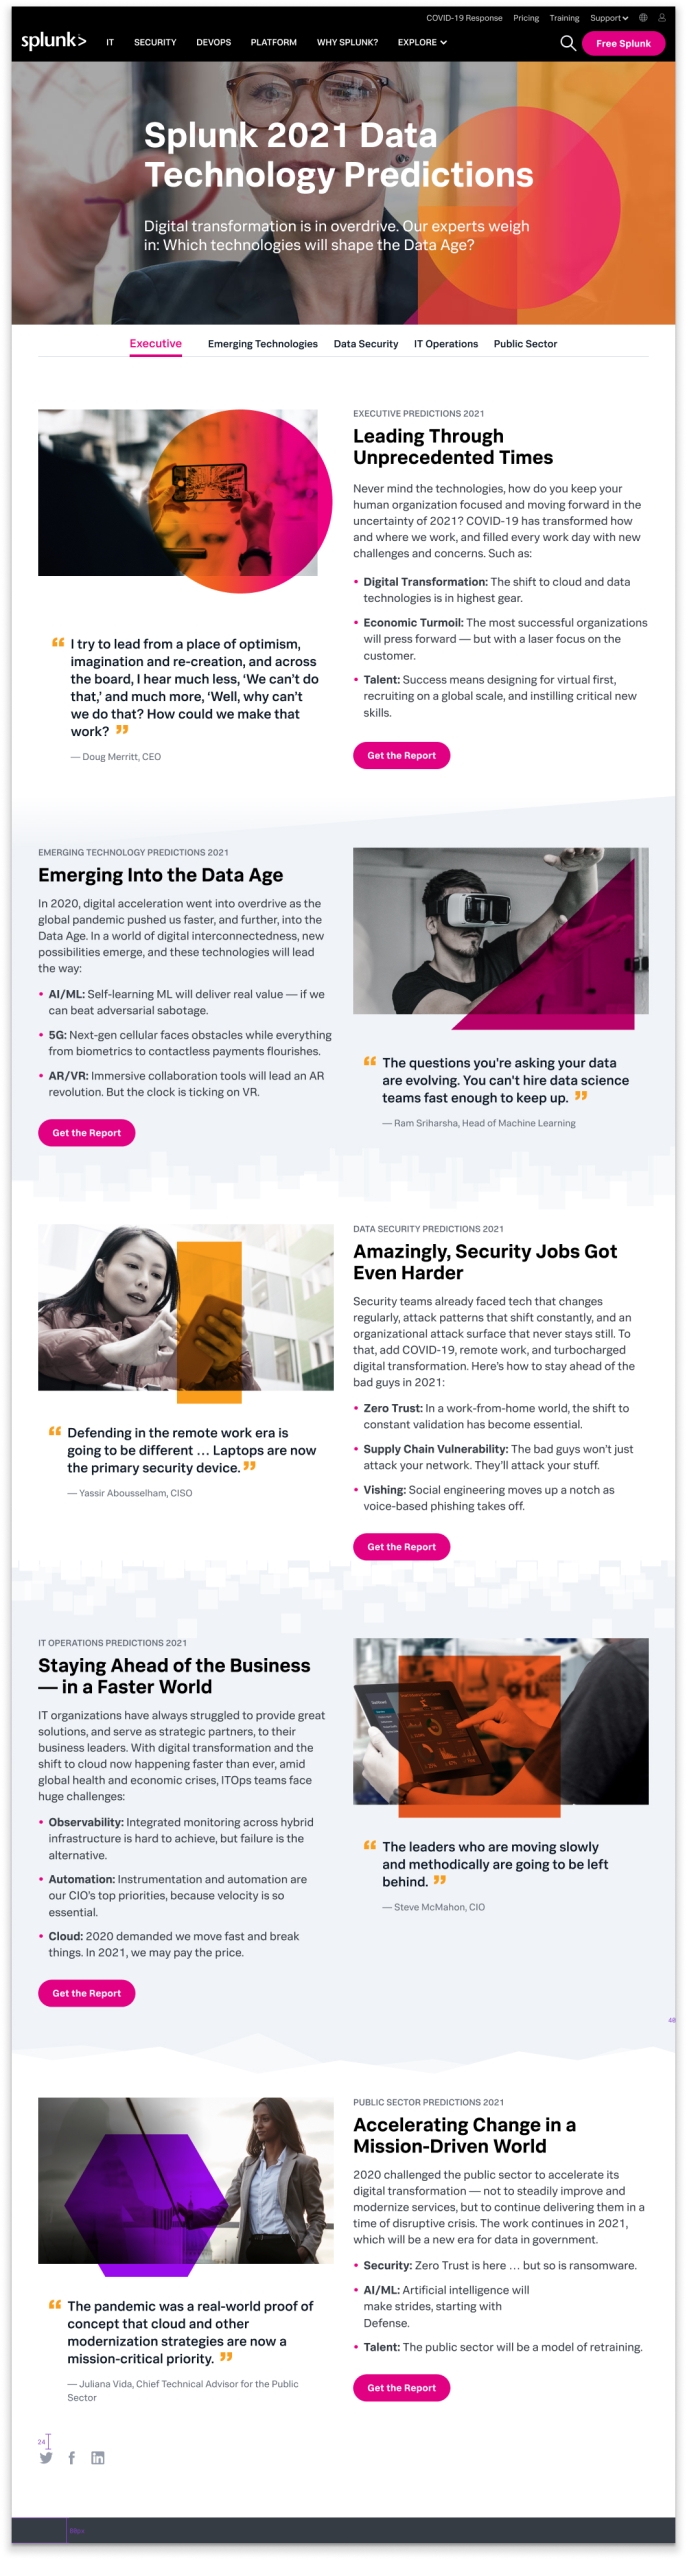
Predictions 2021 Campaign Page

Crafted to activate users with forward-looking insights and guide them towards the full report, demonstrating effective content promotion and user journey optimization.

Customer Story Pages

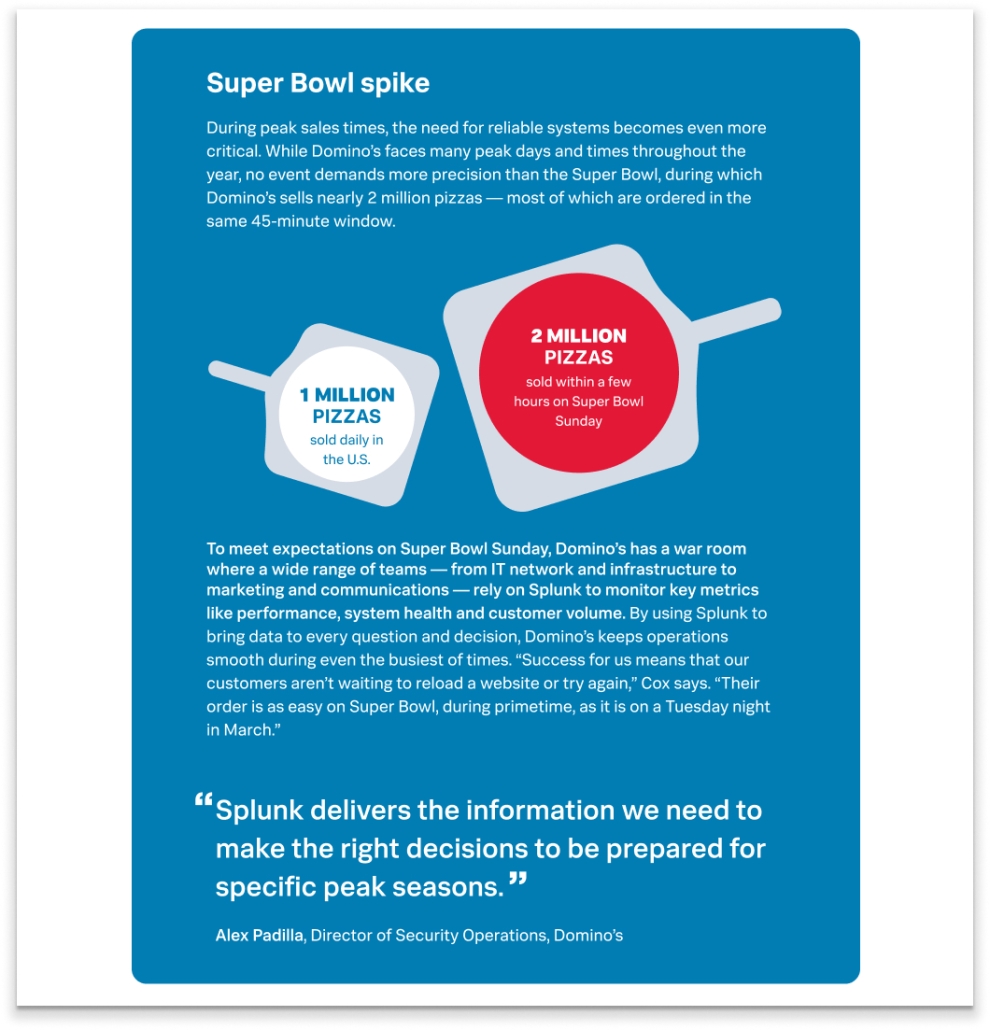
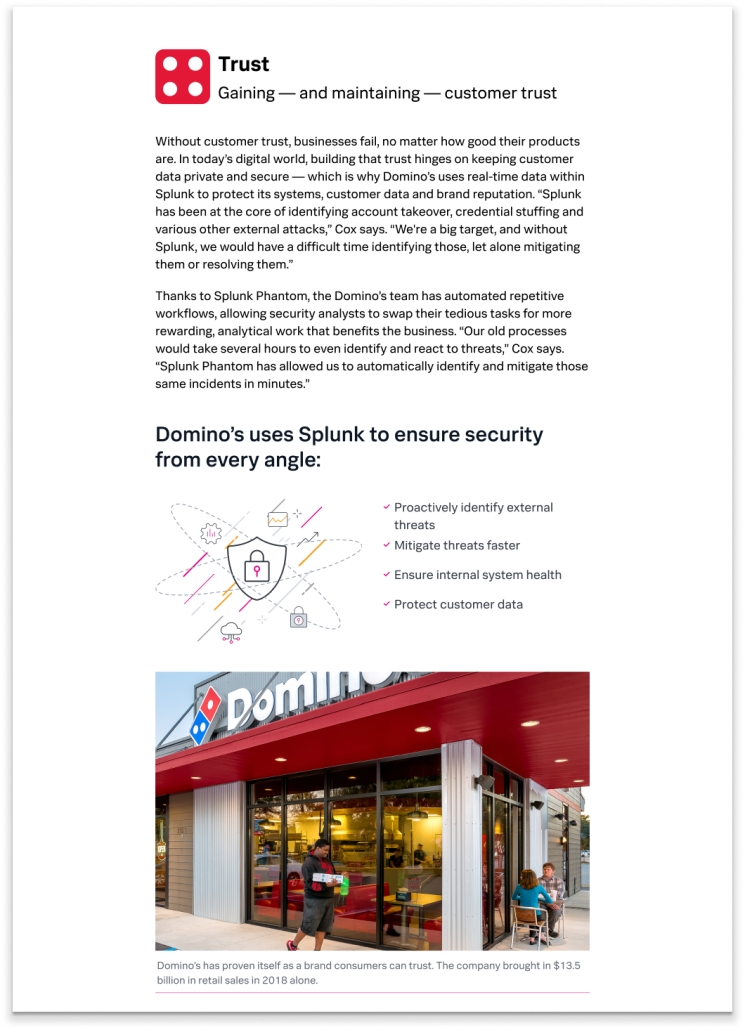
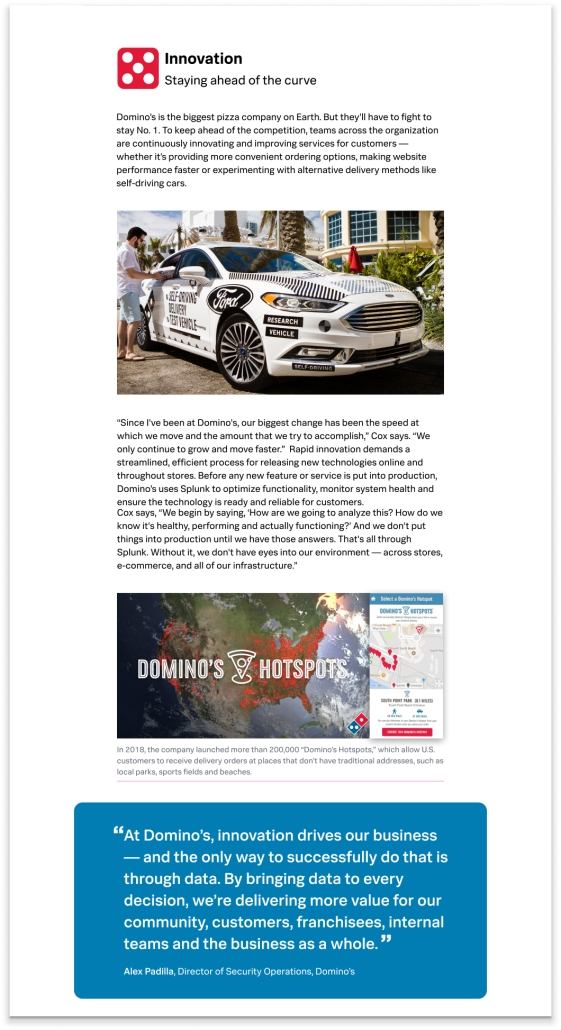
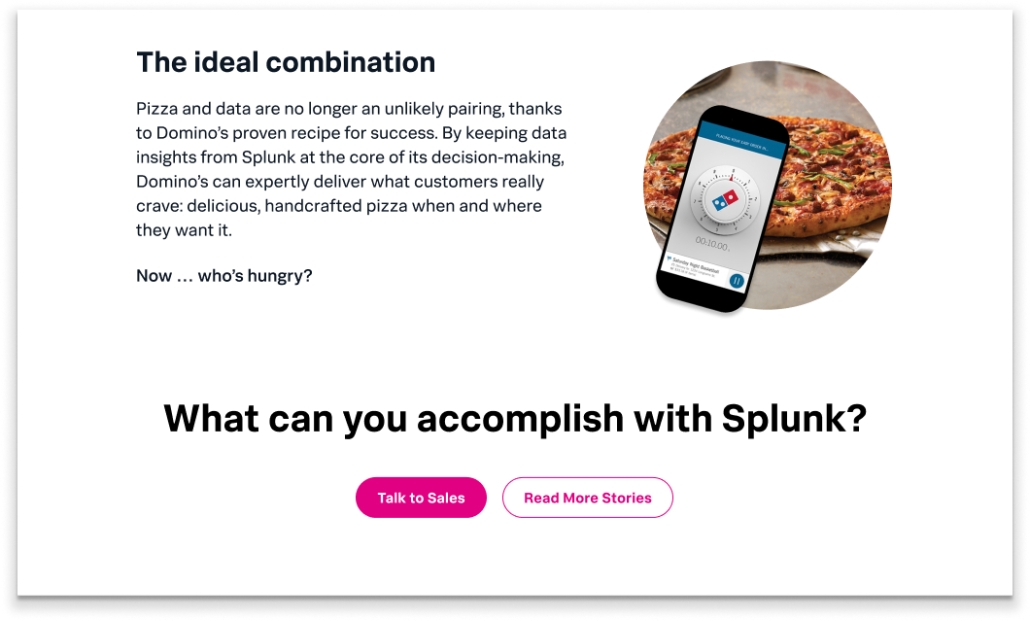
I led UI design for showcase pages featuring client success narratives, including high-profile cases like Domino’s and U.S. Census. These graphic-rich presentations utilized motion, video, and strategic content design to transform testimonials into inspiring digital experiences that demonstrate real-world impact.

The design strategy focused on transforming traditional case studies into compelling visual stories through:

  • Strategic content hierarchy that guides readers through the success journey
  • Integration of video testimonials and product demonstrations
  • Motion graphics that illustrate business impact and ROI
  • Visual storytelling that makes complex technical implementations accessible

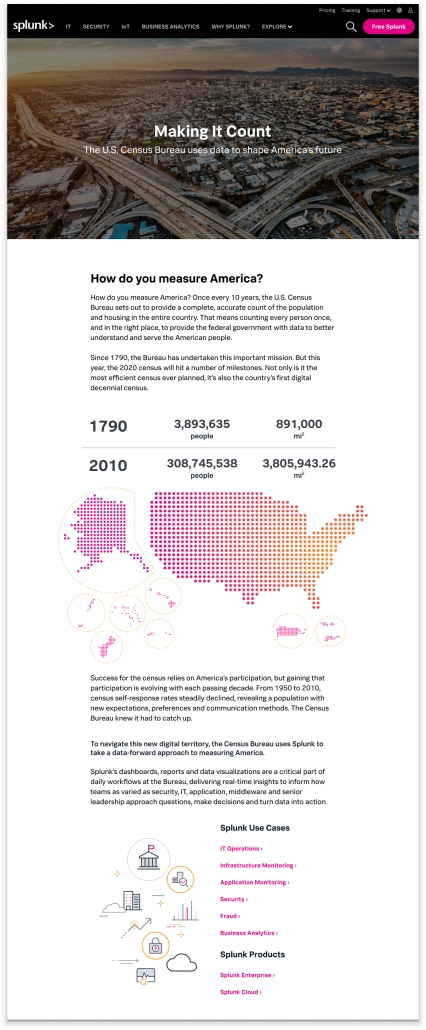
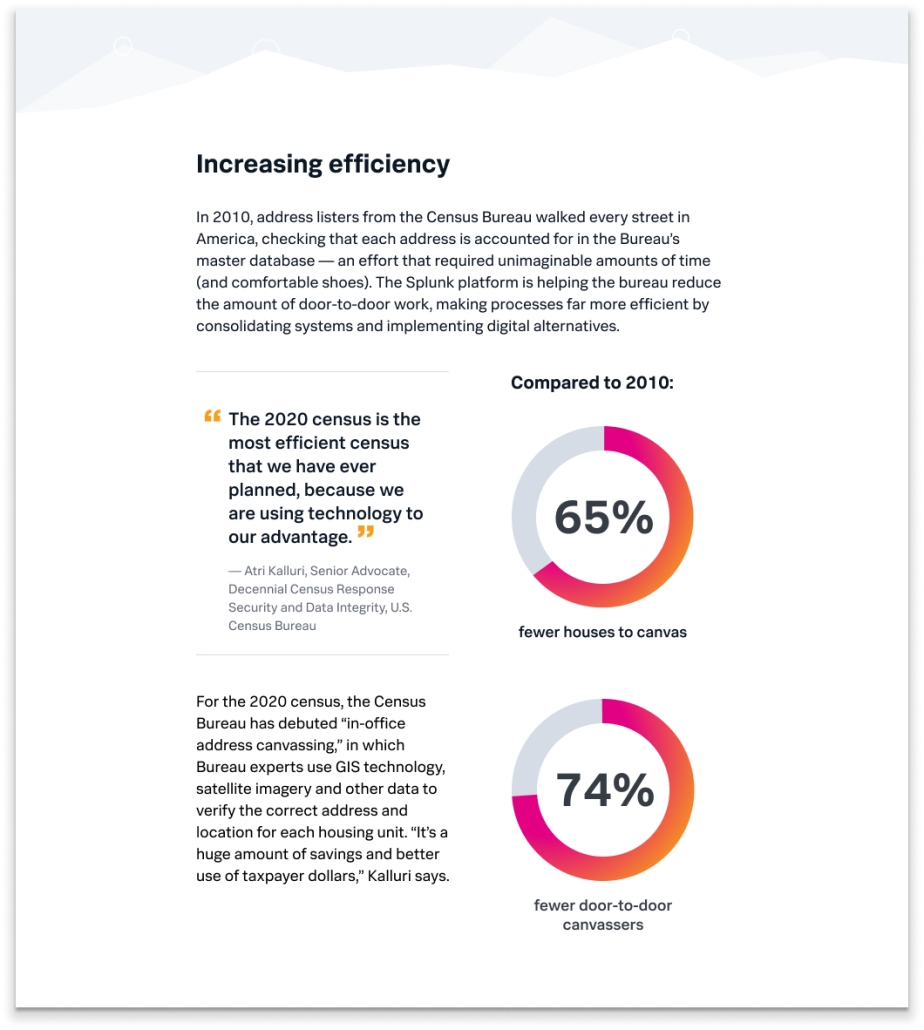
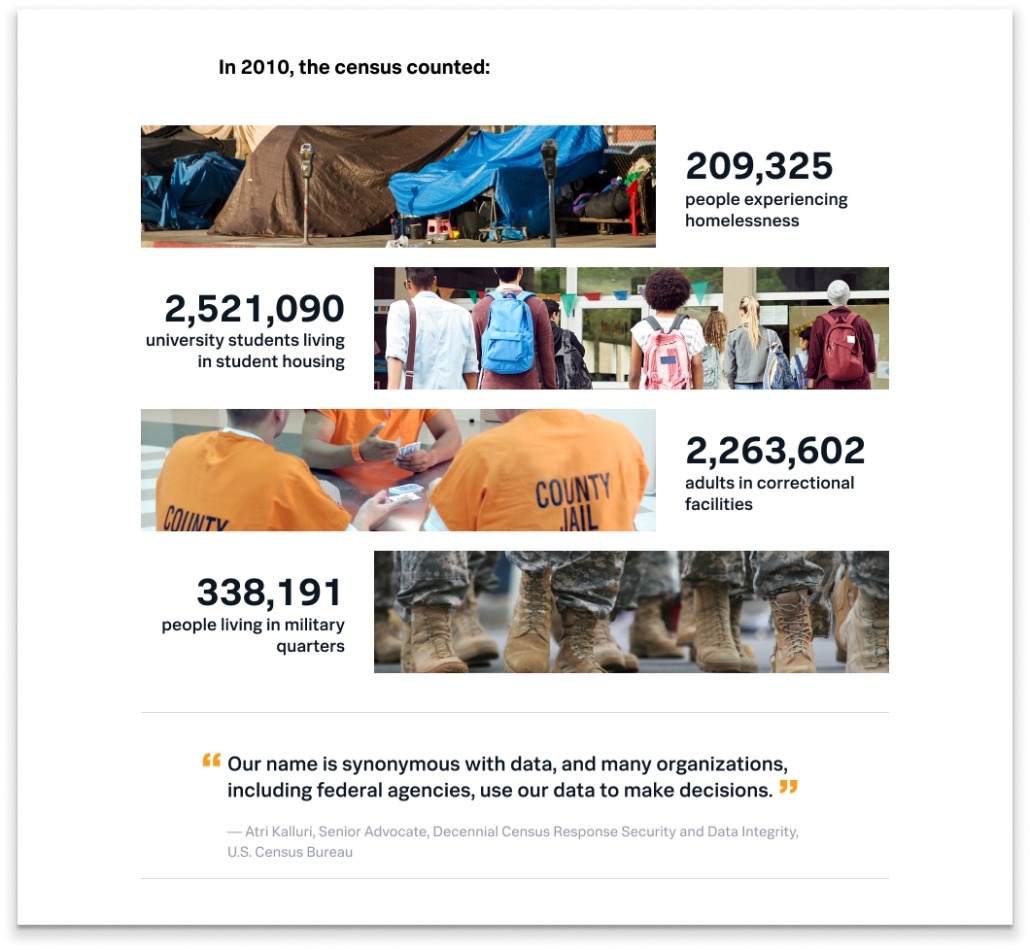
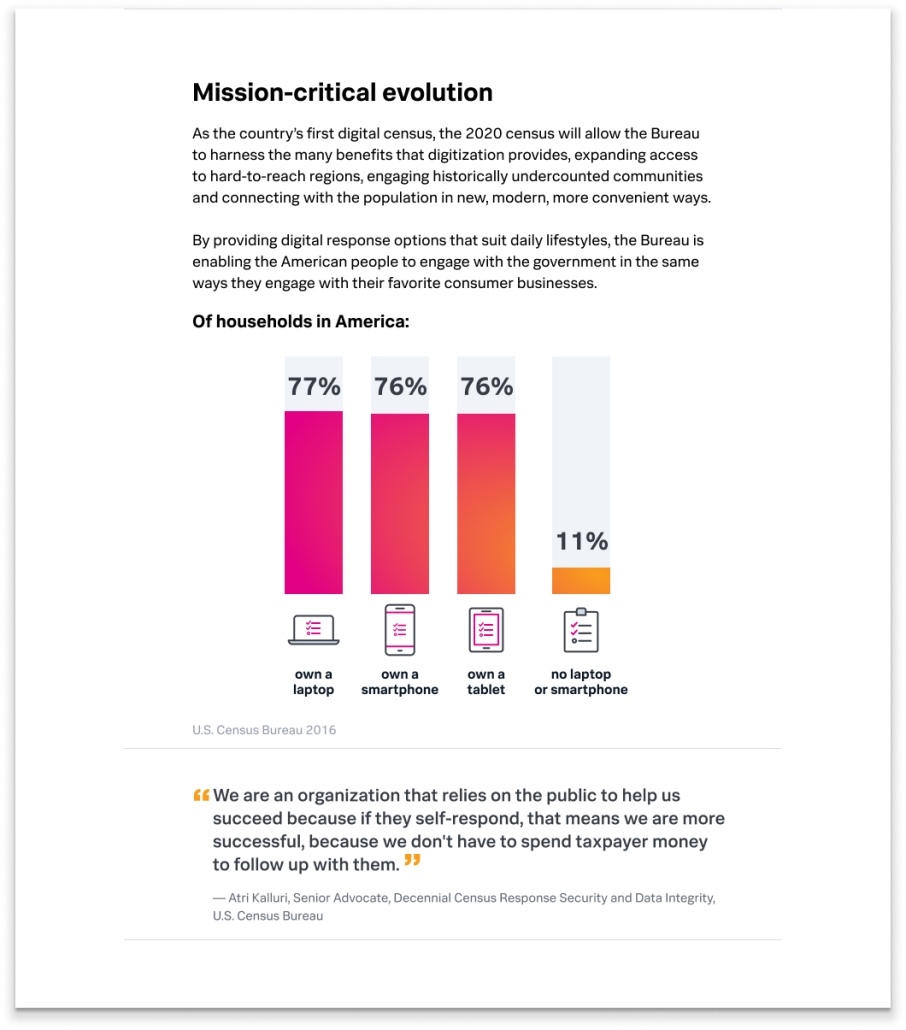
U.S. Census Bureau “Making it Count” Customer Story

This customer story page emphasizes trust and security, showcasing how the Census Bureau used Splunk to protect citizen data during the digital 2020 census. The design balances government credibility with accessible storytelling to demonstrate proactive security operations and fraud prevention capabilities.

Domino’s “Revealing the Secret Sauce” Customer Story

This page illustrates Domino’s transformation from traditional pizza company to data-driven e-commerce leader. The design combines playful brand elements with technical storytelling to show how Splunk powers everything from IT operations to customer experience, reinforcing their position as the global sales leader through innovation.

Results

Best New Enterprise Software Marketing of the Year

Constellation Media Award – The campaign was recognized for its flawless execution.

“…one of the most sophisticated launches of the decade.”

R ‘Ray’ Wang, Principal Analyst and Founder Constellation Research, Inc.

$680M ARR

Growth from 2020 to 2021, with Total Annual Recurring Revenue increasing from $1.68 billion to $2.36 billion (41% year-over-year growth).
*Splunk 2020 Q4 earnings report, Splunk 2021 Q4 earnings report

2x User Conversion Rate on Community Platform

In the first month, achieved 2M+ page views and converted 1.4K+ visitors to registered members, double the previous conversion rate. The redesigned interface drove 15% user posting engagement.

*Splunk Community metrics

510 Enterprise Customers with $1M+ ARR

up from 355 in 2020, representing 44% year-over-year growth in high-value customer relationships.
*Splunk Annual Report 2021

14M+ Page Views in First 9 Months

Across the first 9 months on the Khoros platform, Splunk Community drove 14M+ page views, 7.3K+ new members, 8K+ topics, 22K replies, and 7.4M+ solution views. The community deflected 93K support cases, saving Splunk nearly $3M in support costs.

*Khoros 2021 Customer Awards submission

Ready to create experiences users will love? Contact me and let’s bring your vision to life.